Quantcast
Channel: Severalnines - docker
Viewing all 65 articles
Browse latest View live

MariaDB MaxScale Load Balancing on Docker: Management - Part 2

$
0
0

This blog post is a continuation of MariaDB MaxScale Load Balancing  on Docker: Deployment - Part1. In this part, we are going to focus more on management operations with advanced use cases like service control, configuration management, query processing, security and cluster reconciliation. The example steps and instructions shown in this post are based on the running environments that we have set up in the first part of this blog series.

Service Control

For MaxScale, starting and stopping the container is the only way to control the service. Provided the container has been created, we can use the following command to manage the service:

$ docker start maxscale
$ docker stop maxscale
$ docker restart maxscale

Running without Root Privileges

The Docker containers by default run with the root privilege and so does the application that runs inside the container. This is another major concern from the security perspective because hackers can gain root access to the Docker host by hacking the application running inside the container.

To run Docker as a non-root user, you have to add your user to the docker group. Firstly, create a docker group if there isn’t one:

$ sudo groupadd docker

Then, add your user to the docker group. In this example our user is "vagrant":

$ sudo usermod -aG docker vagrant

Log out and log back in so that your group membership is re-evaluated (or reboot if it does not work). At this point, you can run the MaxScale container with the standard run command (no sudo required) as user "vagrant":

$ docker run -d \
--name maxscale-unprivileged \
-p 4006:4006 \
-p 4008:4008 \
-p 8989:8989 \
-v $PWD/maxscale.cnf:/etc/maxscale.cnf \
mariadb/maxscale

MaxScale process runs by user "maxscale" and requires no special privileges up to the root level. Thus, running the container in non-privileged mode is always the best way if you are concerned about the security.

Configuration Management

For standalone MaxScale container, configuration management requires modification to the mapped configuration file followed by restarting the MaxScale container. However, if you are running as a Docker Swarm service, the new configuration has to be loaded into the Swarm Configs as a new version, for example:

$ cat maxscale.cnf | docker config create maxscale_config_v2 -

Then, update the service by removing the old configs (maxscale_config) and add the new one (maxscale_config_v2) to the same target:

$ docker service update \
--config-rm maxscale_config \
--config-add source=maxscale_config_v2,target=/etc/maxscale.cnf \
maxscale-cluster

Docker Swarm will then schedule container removal and replace procedures one container at a time until the replicas requirement is satisfied.

Upgrade and Downgrade

One of the advantages of running your applications in Docker is trivial upgrade and downgrade procedure. Every running container is based on an image, and this image can be switched easily with the image tag. To get the list of available images for MaxScale, check out the Tags section in the Docker Hub. The following examples show the process to downgrade a MaxScale 2.3 to one minor version earlier, 2.2:

$ docker run -d \
--name maxscale \
-p 4006:4006 \
-p 4008:4008 \
-v $PWD/maxscale.cnf:/etc/maxscale.cnf \
mariadb/maxscale:2.3
$ docker rm -f maxscale
$ docker run -d \
--name maxscale \
-p 4006:4006 \
-p 4008:4008 \
-v $PWD/maxscale.cnf:/etc/maxscale.cnf \
mariadb/maxscale:2.2

Make sure the configuration options are compatible with the version that you want to run. For example, the above downgrade would be failed at the first run due to the following errors:

2019-06-19 05:29:04.301   error  : (check_config_objects): Unexpected parameter 'master_reconnection' for object 'rw-service' of type 'service', or 'true' is an invalid value for parameter 'master_reconnection'.
2019-06-19 05:29:04.301   error  : (check_config_objects): Unexpected parameter 'delayed_retry' for object 'rw-service' of type 'service', or 'true' is an invalid value for parameter 'delayed_retry'.
2019-06-19 05:29:04.301   error  : (check_config_objects): Unexpected parameter 'transaction_replay_max_size' for object 'rw-service' of type 'service', or '1Mi' is an invalid value for parameter 'transaction_replay_max_size'.
2019-06-19 05:29:04.302   error  : (check_config_objects): Unexpected parameter 'transaction_replay' for object 'rw-service' of type 'service', or 'true' is an invalid value for parameter 'transaction_replay'.
2019-06-19 05:29:04.302   error  : (check_config_objects): Unexpected parameter 'causal_reads_timeout' for object 'rw-service' of type 'service', or '10' is an invalid value for parameter 'causal_reads_timeout'.
2019-06-19 05:29:04.302   error  : (check_config_objects): Unexpected parameter 'causal_reads' for object 'rw-service' of type 'service', or 'true' is an invalid value for parameter 'causal_reads'.

What we need to do is to remove the unsupported configuration options as shown above in the configuration file before downgrading the container image:

  • master_reconnection
  • delayed_retry
  • transaction_replay
  • causal_reads_timeout
  • causal_reads

Finally, start the container again and you should be good. Version upgrade for MaxScale works similarly. Just change the tag that you want to use and off you go.

MaxScale Filters

MaxScale uses a component called filter to manipulate or process the requests as they pass through it. There are a bunch of filters you can use, as listed in this page, MaxScale 2.3 Filters. For example, a specific query can be logged into a file if it matches a criteria or you can rewrite the incoming query before it reaches the backend servers.

To activate a filter, you have to define a section and include the definition name into the corresponding service definition, as shown in the examples further down.

Query Logging All (QLA)

As its name explains, QLA filter logs all queries match the set of rule per client session. All queries will be logged following the filebase format.

Firstly, define the component with type=filter and module=qlafilter:

## Query Log All (QLA) filter
## Filter module for MaxScale to log all query content on a per client session basis
[qla-sbtest-no-pk]
type		= filter
module		= qlafilter
filebase	= /tmp/sbtest
match		= select.*from.*
exclude		= where.*id.*
user		= sbtest

Then add the filter component into our services:

[rw-service]
...
filters        = qla-sbtest-no-pk
[rr-service]
...
filters        = qla-sbtest-no-pk

It's also a good idea to map /tmp of the container with the actual directory on the Docker host, so we don't have to access the container to retrieve the generated log files. Firstly, create a directory and give global writable permission:

$ mkdir qla
$ chmod 777 qla

Since we need to bind the above directory into the container, we have to stop and remove the running container and re-run it with the following command:

$ docker stop maxscale
$ docker run -d \
--name maxscale \
--restart always \
-p 4006:4006 \
-p 4008:4008 \
-p 8989:8989 \
-v $PWD/maxscale.cnf:/etc/maxscale.cnf \
-v $PWD/qla:/tmp \
mariadb/maxscale

You can then retrieve the content of the logged queries inside the qla directory:

$ cat qla/*
Date,User@Host,Query
2019-06-18 08:25:13,sbtest@::ffff:192.168.0.19,select * from sbtest.sbtest1

Query Rewriting

Query rewrite is a feature that, depending on the queries running against the database server, quickly allows to isolate and correct problematic queries and improve performance.

Query rewriting can be done via regexfilter. This filter can match or exclude incoming statements using regular expressions and replace them with another statement. Every rule is defined in its own section and include the section name in the corresponding service to activate it.

The following filter will match a number of SHOW commands that we don't want to expose to the read-only clients:

## Rewrite query based on regex match and replace
[block-show-commands]
type            = filter
module          = regexfilter
options         = ignorecase
match           = ^show (variables|global variables|global status|status|processlist|full processlist).*
replace         = SELECT 'Not allowed'

Then we can append the filter to the service that we want to apply. For example, all read-only connections have to be filtered for the above:

[rr-service]
...
filters        = qla-sbtest-no-pk | block-show-commands

Keep in mind that multiple filters can be defined using a syntax akin to the Linux shell pipe "|" syntax. Restart the container to apply the configuration changes:

$ docker restart maxscale

We can then verify with the following query:

$ mysql -usbtest -p -h192.168.0.200 -P4006 -e 'SHOW VARIABLES LIKE "max_connections"'
+-------------+
| Not allowed |
+-------------+
| Not allowed |
+-------------+

You will get the result as expected.

Cluster Recovery

MaxScale 2.2.2 and later supports automatic or manual MariaDB replication or cluster recovery for the following events:

  • failover
  • switchover
  • rejoin
  • reset-replication

Failover for the master-slave cluster can and often should be set to activate automatically. Switchover must be activated manually through MaxAdmin, MaxCtrl or the REST interface. Rejoin can be set to automatic or activated manually. These features are implemented in the "mariadbmon" module.

The following automatic failover events happened if we purposely shutdown the active master, 192.168.0.91:

$ docker logs -f maxscale
...
2019-06-19 03:53:02.348   error  : (mon_log_connect_error): Monitor was unable to connect to server mariadb1[192.168.0.91:3306] : 'Can't connect to MySQL server on '192.168.0.91' (115)'
2019-06-19 03:53:02.351   notice : (mon_log_state_change): Server changed state: mariadb1[192.168.0.91:3306]: master_down. [Master, Running] -> [Down]
2019-06-19 03:53:02.351   warning: (handle_auto_failover): Master has failed. If master status does not change in 4 monitor passes, failover begins.
2019-06-19 03:53:16.710   notice : (select_promotion_target): Selecting a server to promote and replace 'mariadb1'. Candidates are: 'mariadb2', 'mariadb3'.
2019-06-19 03:53:16.710   warning: (warn_replication_settings): Slave 'mariadb2' has gtid_strict_mode disabled. Enabling this setting is recommended. For more information, see https://mariadb.com/kb/en/library/gtid/#gtid_strict_mode
2019-06-19 03:53:16.711   warning: (warn_replication_settings): Slave 'mariadb3' has gtid_strict_mode disabled. Enabling this setting is recommended. For more information, see https://mariadb.com/kb/en/library/gtid/#gtid_strict_mode
2019-06-19 03:53:16.711   notice : (select_promotion_target): Selected 'mariadb2'.
2019-06-19 03:53:16.711   notice : (handle_auto_failover): Performing automatic failover to replace failed master 'mariadb1'.
2019-06-19 03:53:16.723   notice : (redirect_slaves_ex): Redirecting 'mariadb3' to replicate from 'mariadb2' instead of 'mariadb1'.
2019-06-19 03:53:16.742   notice : (redirect_slaves_ex): All redirects successful.
2019-06-19 03:53:17.249   notice : (wait_cluster_stabilization): All redirected slaves successfully started replication from 'mariadb2'.
2019-06-19 03:53:17.249   notice : (handle_auto_failover): Failover 'mariadb1' -> 'mariadb2' performed.
2019-06-19 03:53:20.363   notice : (mon_log_state_change): Server changed state: mariadb2[192.168.0.92:3306]: new_master. [Slave, Running] -> [Master, Running]

After failover completes, our topology is now looking like this:

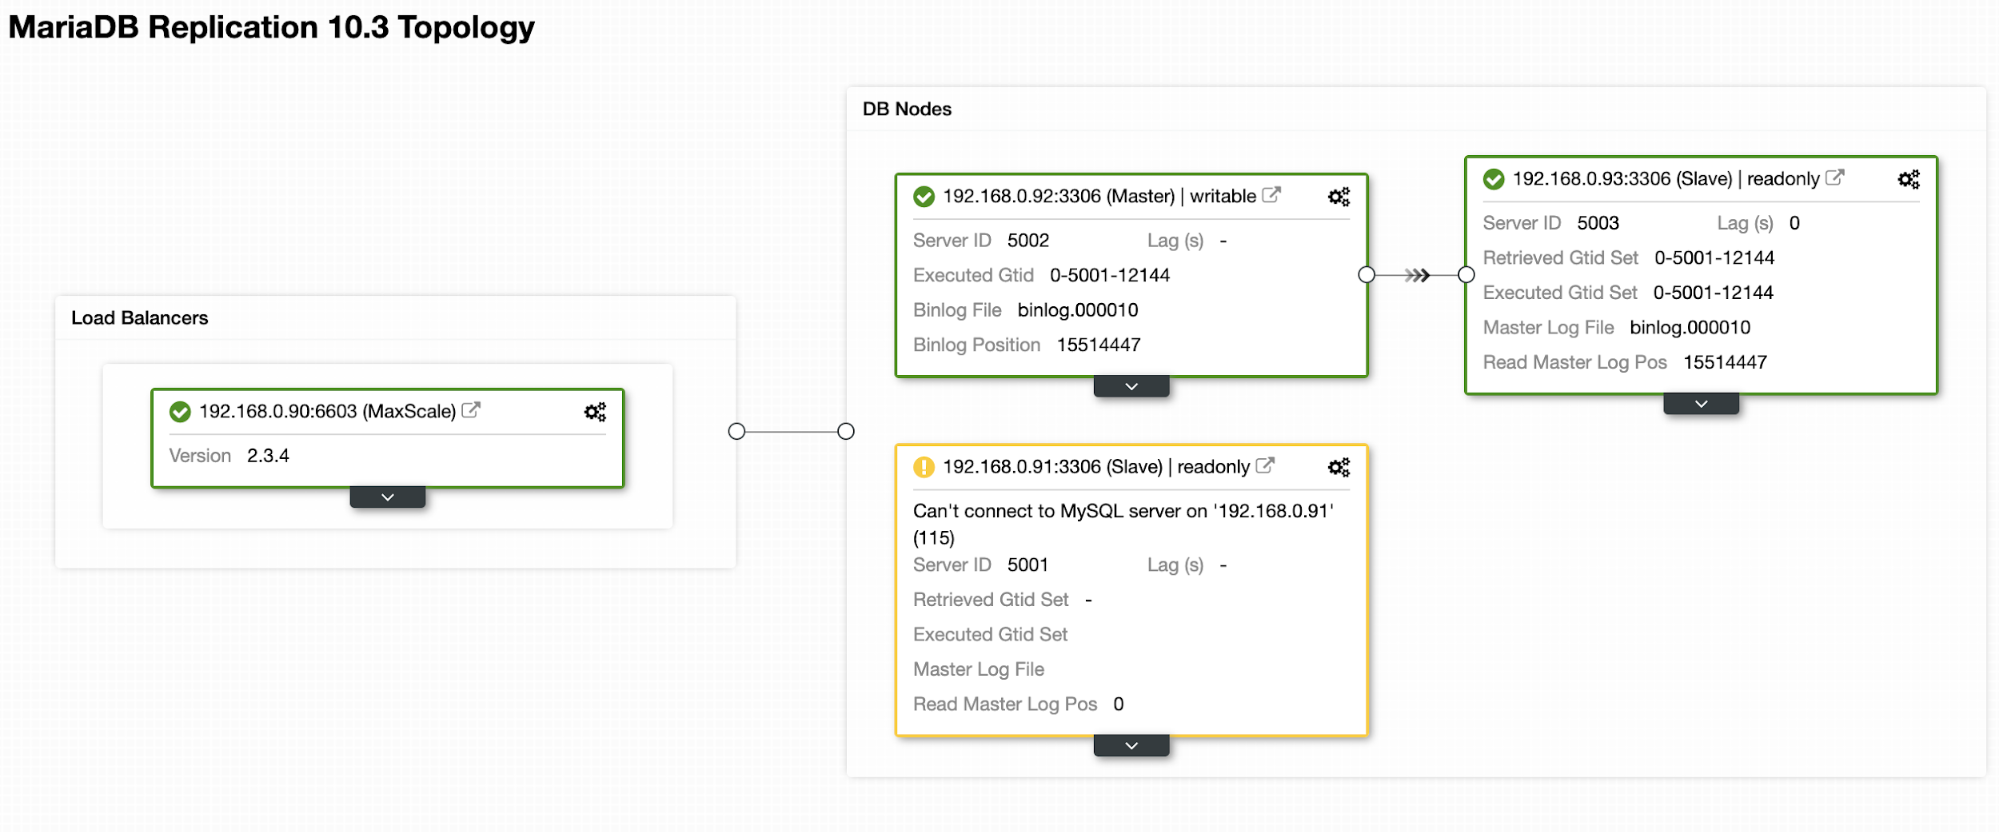
For switchover operation, it requires human intervention and one way to do it through MaxCtrl console. Let's say the old master is back operational and is ready to be promoted as a master, we can perform the switchover operation by sending the following command:

$ docker exec -it maxscale maxctrl
maxctrl: call command mariadbmon switchover monitor mariadb1 mariadb2
OK

Where, the formatting is:

$ call command <monitoring module> <operation> <monitoring section name> <new master> <current master>

Then, verify the new topology by listing out the servers:

 maxctrl: list servers
┌──────────┬──────────────┬──────┬─────────────┬─────────────────┬──────────────┐
│ Server   │ Address      │ Port │ Connections │ State           │ GTID         │
├──────────┼──────────────┼──────┼─────────────┼─────────────────┼──────────────┤
│ mariadb1 │ 192.168.0.91 │ 3306 │ 0           │ Master, Running │ 0-5001-12144 │
├──────────┼──────────────┼──────┼─────────────┼─────────────────┼──────────────┤
│ mariadb2 │ 192.168.0.92 │ 3306 │ 0           │ Slave, Running  │ 0-5001-12144 │
├──────────┼──────────────┼──────┼─────────────┼─────────────────┼──────────────┤
│ mariadb3 │ 192.168.0.93 │ 3306 │ 0           │ Slave, Running  │ 0-5001-12144 │
└──────────┴──────────────┴──────┴─────────────┴─────────────────┴──────────────┘

We just promoted our old master back to its original spot. Fun fact, ClusterControl automatic recovery feature does exactly the same thing if it is enabled.

Final Thoughts

Running MariaDB MaxScale on Docker brings additional benefits like MaxScale clustering, easy to upgrade and downgrade, and also advanced proxying functionalities for MySQL and MariaDB clusters.


How to Monitor PostgreSQL Running Inside a Docker Container

$
0
0

Monitoring is the action of watching and checking over a period of time in order to see how what you are monitoring develops and performs. You do it so you can make any necessary changes to ensure things work correctly. It is essential that processes are monitored to produce good insights into the activities that are being performed in order to plan, organize, and run an efficient solution.

Docker is a program created to operate as a builder ready to answer the question “Will the software run on my machine?” It basically assembles different parts together creating a model easy to store and transport. The model, also known as container, can be shipped to any computer which has Docker installed.

In this article we will be introduced to Docker, describing some ways of configuration and comparing them. Furthermore PostgreSQL comes to play, and we will deploy it inside a Docker container in a smart way, and finally, we will see the benefits that ClusterControl can provide, to monitor key metrics about PostgreSQL and the OS outside of it.

Docker Overview

When Docker starts, it creates a new network connection to allow the transmission of data between two endpoints, called bridge, and this is where new containers are held by default.

In the following, we will see details about this bridge, and discuss why it’s not a good idea to use in production.

$ docker network inspect bridge
Inspecting the Docker default bridge docker0
Inspecting the Docker default bridge docker0.

Please note the embedded options, because if you run a container without specify the desired network you will agree with it.

On this default network connection, we lose some good advantages of networking, like DNS. Imagine that you want to access Google, which one address do you prefer, www.google.com, or 172.217.165.4?

I don’t know about you but I prefer the earlier choice, and to be honest, I don’t type the ‘www.’.

User-Defined Bridge Network

So we want DNS in our network connection, and the benefit of isolation, because imagine the scenario where you deploy different containers inside of the same network.

When we create a Docker container, we can give a name into it, or Docker makes it for us randomizing two words connected by underline, or ‘_’.

If we don’t use a User-Defined Bridge Network, in the future could be a problem in the middle of the IP addresses, because we are clearly not machines, and remember these values can be hard and error-prone.

Creating a custom bridge, or a User-Defined Bridge Network, is very easy.

Before creating our first one, to understand the process better, let’s open a new terminal, type a Linux command of the package iproute2, and forget about it by now.

$ ip monitor all
Initializing a terminal to monitor the network traffic in the Docker Host.

This terminal will now be listening to the network activity and displaying there.

You may have seen commands like “ifconfig”, or “netstat” before, and I tell you that they are deprecated since 2001. The package net-tools is still widely used, but not updated anymore.

Now it’s time to create our first custom network, so open another terminal and enter:

$ docker network create --driver bridge br-db
Creating the User-Defined Bridge Network "br-db".

This very long mix of letters and numbers is called UUID, or Universally Unique IDentifier. It’s basically saying that the network has been created successfully.

The given name for our first network manually created has been “br-db”, and it needs to be in the final of the command, but before that, we have the argument ‘“-driver”, and then the value “bridge”, why?

In the Community Edition, Docker provides three different drivers available: bridge, host, and none. At creation time, like this, the default is bridge and it doesn’t need to be specified, but we are learning about it.

If you’ve done everything with me, look at the other terminal because I will explain what is going on to you.

Docker has created the network, called “br-db”, but this is only called like this by him.

On the other side of this custom bridge created, there is another layer, the OS. The given name for the same bridge network has changed, and becomes a representation of the nomenclature for bridge, “br”, followed by the first 12 characters of the UUID value above, in red.

Monitoring Docker IP address changes.

With our new network connection, we have a subnet, gateway, and broadcast. 

The Gateway, as the name suggests, is where all the traffic of packets happens between the bridge endpoints, and it is called “inet” for the OS as you can see.

Broadcast stands in the last IP address, and is responsible for sending the same traffic of data for all the IP addresses in the subnet when necessary.

They are always present in network connections, and this is why we have at the beginning of the output, the value “[ADDR]”. This value represents IP address changes, and it is like an event being fired for the network activity monitoring, because we have created a new network connection!

Docker Container

Please visit the Docker Hub, and see that what is there is known as Docker Image, and it is basically the skeleton of the container (model).

Docker Images are generated by Dockerfiles, and they contain all the information needed to create a container, in order to make it easy to maintain and customize.

If you look with attention into the Docker Hub, it’s easy to see that the PostgreSQL image, called postgres, have different tags and versions, and if you don’t specify one of them the default will be used, the latest, but maybe in the future if you need different containers of PostgreSQL working together, you may want them to be in the same version.

Let’s create our first right container now, remember the need for the argument ‘--network’, or it will be deployed in the default bridge.

$ docker container run --name postgres-1 --network br-db -e POSTGRES_PASSWORD=5af45Q4ae3Xa3Ff4 -p 6551:5432 -d postgres
Running a PostgreSQL container into the network "br-db".

Again the UUID, success, and in the other terminal, what is going on?

Network interface changes is the event happening right now, or simply “[LINK]”. Anything after the “veth” you can forget, trust me, the value always changes when the container is restarted or something similar happens.

Monitoring Docker network interface changes.

The other option “-e POSTGRES_PASSWORD=?” stands for Environment, and it is only available when running PostgreSQL containers, it is configuring the password for the super user account in the database, called postgres.

Publish is the long name for the “-p 6551:5432” parameter, and it’s basically making the OS port 6551 bi-directional bound to the port 5432 of the container.

Last but not less important, is the Detach option, “-d”, and what it does is make the container run independent of this terminal.

The Docker Image name must be in the end, following the same pattern of the network creation, having all the arguments and options in the left, and at the end the most important thing, in this case, the image name.

Remember that the containers are held in the network subnet, standing on IP addresses allowed for each one of them, and they will never be in the first or last address, because the Gateway and Broadcast will be always there.

We have shown the details of the created bridge, and now will be displayed by each one of the endpoints these details kept by them.

$ docker network inspect br-db
Inspecting the Docker User-Defined Network Interface "br-db".
$ brctl show
Displaying information about the User-Defined Bridge Network by the Docker Host.

As you can see, the network and container names differ, having the second being recognized as an interface by the OS, called “veth768ff71”, and the original name given by us “postgres-1” for Docker.

In the Docker command is possible to note the IP address for the container created earlier, the subnet matching what appeared in the other terminal opened moments ago, and lastly the options empty for this custom network.

The Linux command “brctl show” is part of the package bridge-utils, and as the name suggests, its purpose is to provide a set of tools to configure and manage Linux Ethernet bridges.

Another Custom Bridge Network

We will discuss about DNS soon, but it has been very good make things simple for us in the future. Great configurations tend to make the life of the DBA easier in the future.

With networks is the same, so we can change how the OS recognizes subnet the address and the network name adding more arguments at creation time.

$ docker network create --driver bridge --subnet 172.23.0.0/16 -o “com.docker.network.bridge.name”=”bridge-host” bridge-docker
Creating a User-Defined Bridge Network Interface with custom options.
$ ip route show
Displaying the Docker routing table.

With this Linux command, we can see almost the same thing as the other command earlier, but now instead of listing the “veth” interfaces for each network, we simply have this “linkdown” displaying those who are empty.

The desired subnet address has been specified as an argument, and similar to the Environment option for the container creation, for network we have the “-o” followed by the pair of key and value. In this case, we are telling Docker, to tell the OS, that he should call the network as “bridge-host”.

The existence of those three networks can be verified in Docker too, just enter:

$ docker network ls
Displaying network interfaces on Docker Engine.

Now we have discussed earlier that the values of these “veth” for the containers don’t matter, and I will show you in practice.

The exercise consists of verifying the current value, then restart the container, then verify again. To do so we will need a mix of Linux commands used before, and Docker ones, which are new here but very simple:

$ brctl show
$ docker container stop postgres-1
$ docker container start postgres-1
$ brctl show
Checking how "iptables" makes the container names volatile for the Docker Host.

When the container is stopped, the IP address must be set free to receive a new one if necessary, and that’s a reminder of how DNS can be important.

The OS gives these names for the interfaces every time a container stands in an IP address, and they are generated using the package iptables, who will soon be replaced by the new framework called nftables.

It’s not recommended to change these rules, but exists tools available to help with their visualization, if necessary, like dockerveth.

Container Restart Policy

When we restart the Docker program, or even the computer, the networks created by him are kept in the OS, but empty.

Containers have what is called Container Restart Policy, and this is another very important argument specified at creation time. PostgreSQL, as a production database, his availability is crucial, and this is how Docker can help with it.

$ docker container run --name postgres-2 --network bridge-docker --restart always -e POSTGRES_PASSWORD=5af45Q4ae3Xa3Ff4 -p 6552:5432 -d postgres
Specifying the Container Restart Policy at creation time.

Unless you stop it manually, this container “postgres-2” will be always available.

To understand it better, the containers running will be displayed and the Docker program restarted, then the first step again:

$ docker container ls
$ systemctl restart docker
$ docker container ls
Checking the Container Restart Policy in "postgres-2".

Only the container “postgres-2” is running, the another “postgres-1” container doesn’t starts alone. More information about it can be seen in the Docker Documentation.

Domain Name System (DNS)

One benefit of the User-Defined Bridge Network is the organization, certainly, because we can create as many as we want to run new containers and even connect old ones, but another benefit that we don’t have using the Docker default bridge, is DNS.

When containers need to communicate with each other can be painful for the DBA to memorize the IP addresses, and we have discussed it earlier showing the example of www.google.com and 172.217.165.4. DNS solves this problem seamlessly, making possible to interact with containers using their names given at creation time by us, like “postgres-2”, instead of the IP address “172.23.0.2”.

Let’s see how it works. We will create another container just for demonstration purposes in the same network called “postgres-3”, then, we’ll install the package iputils-ping to transmit packets of data to the container “postgres-2”, using its name of course.

$ docker container run --name postgres-3 --network bridge-docker --restart always -e POSTGRES_PASSWORD=5af45Q4ae3Xa3Ff4 -p 6553:5432 -d postgres
$ docker container exec -it postgres-3 bash

For a better understanding let’s separate it into parts, in the following outputs, the blue arrow will indicate when the command is performed inside of a container, and in red, in the OS.

Running a temporary container to test the DNS provided by the User-Defined Bridge Network Interface.
$ apt-get update && apt-get install -y iputils-ping
Installing the package "iputils-ping" for testing the DNS.
$ ping postgres-2
Showing the DNS working successfully.

Summary

PostgreSQL is running inside of Docker, and his availability is guaranteed by now. When used inside of a User-Defined Bridge Network, the containers can be managed easier with many benefits such as DNS, custom subnet addresses and OS names for the networks.

We have seen details about Docker, and the importance of being aware of updated packages and frameworks on the OS.

How to Monitor PostgreSQL Running Inside a Docker Container - part 2

$
0
0

This is the second part of the multi-series How to Monitor PostgreSQL Running Inside a Docker Container. In Part 1, I presented an overview of docker containers, policies and networking. In this part we will continue with docker configuration and finally enable monitoring via ClusterControl.

PostgreSQL is an old school, open-source database whose popularity is still increasing, being widely used and accepted on most cloud environments of today. 

When it’s used inside of a container it can be easily configured and managed by Docker, using different tags for the creation and shipped to any computer in the world with Docker installed, but this is all about Docker.

Now we will discuss about PostgreSQL, and to start, let’s list their six main processes running simultaneously inside of a container by the OS user called “postgres”, which is a different one from the “postgres” user inside of the database, that one is a super user.

Remember that the blue arrow in the images is displaying commands entered inside of a container.

$ ps auxww
PostgreSQL main processes

The first process on the list is the PostgreSQL server, and the others are started by him. Their duties are basically to analyze what is going on in the server, being sub-processes performing statistics inputs, writing logs, and these kinds of things.

We will use ClusterControl to monitor the activity inside of this container having the PostgreSQL server, and to do so we will need to have SSH installed in order to connect them safely.

Secure Shell Server (SSH)

To collect the information about the PostgreSQL container, nothing is better than SSH. It gives remote access for one IP address to another, and this all the ClusterControl needs to perform the job.

SSH needs to be downloaded from the repository, and to do so we must be inside of the container.

$ docker container exec -it postgres-2 bash
$ apt-get update && apt-get install -y openssh-server openssh-client
Installing SSH in the container "postgres-2"

After install we’ll edit the configuration, start the service, setup a password for the root user, and finally leave the container:

$ sed -i 's|^PermitRootLogin.*|PermitRootLogin yes|g' /etc/ssh/sshd_config
$ sed -i 's|^#PermitRootLogin.*|PermitRootLogin yes|g' /etc/ssh/sshd_config
$ service ssh start
$ passwd
$ exit
Configuring the SSH in the "postgres-2" container, part 1/2

Monitoring with ClusterControl

ClusterControl has an in-depth integration system able to monitor all the processes of PostgreSQL in real-time, also coming with a library of Advisors to keep the data secure, track the database performance, and of course providing alerts when anomalies happens.

With SSH configured, ClusterControl can monitor the OS hardware activity and give insights about both the database and the outside layer.

We will run be running a new container, and publishing it to the port 5000 of our computer, then we will be able to access the system through our browser.

$ docker container run --name s9s-ccontrol --network bridge-docker -p 5000:80 -d severalnines/clustercontrol
Running the container "s9s-ccontrol" for Severalnines ClusterControl

Once deployed, only remains the SSH configuration, and we have good news, because we are in a User-Defined Bridge Network, we can use DNS!

$ docker container exec -it s9s-ccontrol bash
$ ssh-copy-id postgres-2
Configuring the SSH in the "postgres-2" container, part 2/2

After enter “yes” and specify the password provided earlier, it’s possible to access the “postgres-2” container as root using SSH:

$ ssh postgres-2
Checking the SSH connection successfully

This new color, light blue, will be used in the following to represent the activity inside of the database. In the example above we have accessed the “postgres-2” container from “s9s-ccontrol”, but it’s still the root user. Keep your attention and criticism with me.

So the next step is going to the browser and access http://localhost:5000/clustercontrol/users/welcome/ and register an account, or if you already have one, visit http://localhost:5000/clustercontrol/users/login.

Then “Import Existing Server/Cluster” and enter the earlier configuration. The tab “PostgreSQL & TimescaleDB” must be selected. In the field “SSH User” for this demonstration just type “root”. Then finally enter the “Cluster Name”, and it can be any name that you want, is simply who will hold as many necessaries PostgreSQL containers that you want to import and monitor.

Importing the "postgres-2" database, part 1/2

Now it’s time to enter the information about the PostgreSQL container, the User “postgres”, Password “5af45Q4ae3Xa3Ff4” and the desired containers. It’s extremely important to remember that the SSH service must be active inside of the PostgreSQL container.

Importing the "postgres-2" container, part 2/2

After press the “Import” button, ClusterControl will start to manage the PostgreSQL container “postgres-2” inside of the Cluster called “PostgreSQL”, and it will inform when the process of importing is done.

Log about the process of importing the container "postgres-2"

Once finished, the system will be shown under the Clusters tab, our most recently created Cluster and different options separated in sections

Our first visualization step will be in the Overview option.

PostgreSQL Cluster imported successfully

As you can imagine, our database is empty and we don’t have any chaos here for our fun, but the graphic still works being engaged in a small scale containing statistics about the SQL and Database processes.

Displaying statistics about the SQL and Database activity

Real World Scenario Simulation

To give some action, I’ve created a CSV file using Python, exploring the GitHub repository of Socratica, who provides amazing courses on YouTube, and they make those files available for free.

In summary, the created CSV file have 9 millions, 999 thousands and 999 records about persons, each one containing ID, first name, last name, and birthday. The size of the file is 324 MB:

$ du -s -h persons.csv
Checking the size of the CSV file

We will copy this CSV file into the PostgreSQL container, then copy it again but this time into the database, and finally check the statistics in ClusterControl.

$ docker container cp persons.csv postgres-2:/persons.csv
$ docker container exec -it postgres-2 bash
$ du -s -h persons.csv
$ su - postgres
$ psql
Transfering the CSV file to the container and entering in the database

Ok, so we are in the database now, as the super user “postgres”, please note the different colors in the arrows.

Now, we must create the database, table, and populate it with the data contained in the CSV file, and finally check if everything is working fine.

$ CREATE DATABASE severalnines;
$ \c severalnines;
$ CREATE TABLE persons (id SERIAL NOT NULL, first_name VARCHAR(50), last_name VARCHAR(50), birthday DATE, CONSTRAINT persons_pkey PRIMARY KEY (id));
$ COPY persons (id, first_name, last_name, birthday) FROM '/persons.csv' DELIMITER ',' CSV HEADER;
Connecting to the new database and importing the CSV file

This process takes some minutes to complete.

Ok, so now let’s enter some queries:

Queries in the database "severalnines"

If you look at ClusterControl now, some movement in the statistics about the hardware happened:

Displaying statistics about the CPU inside of ClusterControl

An entire section to monitor the queries is provided with ease of use UI:

Displaying statistics about the Queries inside of ClusterControl

Statistics about the PostgreSQL database serve the best DBAs to perform their entire potential on their main duties, and ClusterControl is a complete system to analyze every activity happening at real time, giving information based on all the data collected from the database processes.

With ClusterControl the DBA also can easily extend their skills using a full set of tools to create Backups locally or in the Cloud, Replications, Load Balancers, integrations with services, LDAP, ChatOps, Prometheus, and so much more.

Conclusion

Through this article, we’ve been configuring PostgreSQL inside of Docker, and integrating with ClusterControl using User-Defined Bridge Network and SSH, simulating a scenario populating the database with a CSV file, and then doing an overall quick check in the ClusterControl user interface.

MySQL on Docker: ProxySQL Native Clustering with Kubernetes

$
0
0

ProxySQL has supported native clustering since v1.4.2. This means multiple ProxySQL instances are cluster-aware; they are aware of each others' state and able to handle the configuration changes automatically by syncing up to the most up-to-date configuration based on configuration version, timestamp and checksum value. Check out this blog post which demonstrates how to configure clustering support for ProxySQL and how you could expect it to behave.

ProxySQL is a decentralized proxy, recommended to be deployed closer to the application. This approach scales pretty well even up to hundreds of nodes, as it was designed to be easily reconfigurable at runtime. To efficiently manage multiple ProxySQL nodes, one has to make sure whatever changes performed on one of the nodes should be applied across all nodes in the farm. Without native clustering, one has to manually export the configurations and import them to the other nodes (albeit, you could automate this by yourself).

In the previous blog post, we have covered ProxySQL clustering via Kubernetes ConfigMap. This approach is more or less pretty efficient with the centralized configuration approach in ConfigMap. Whatever loaded into ConfigMap will be mounted into pods. Updating the configuration can be done via versioning (modify the proxysql.cnf content and load it into ConfigMap with another name) and then push to the pods depending on the Deployment method scheduling and update strategy.

However, in a rapidly changing environment, this ConfigMap approach is probably not the best method because in order to load the new configuration, pod rescheduling is required to remount the ConfigMap volume and this might jeopardize the ProxySQL service as a whole. For example, let's say in our environment, our strict password policy requires to force MySQL user password expiration for every 7 days, which we would have to keep updating the ProxySQL ConfigMap for the new password on a weekly basis. As a side note, MySQL user inside ProxySQL requires user and password to match the one on the backend MySQL servers. That's where we should start making use of ProxySQL native clustering support in Kubernetes, to automatically apply the configuration changes without the hassle of ConfigMap versioning and pod rescheduling.

In this blog post, we’ll show you how to run ProxySQL native clustering with headless service on Kubernetes. Our high-level architecture can be illustrated as below:

We have 3 Galera nodes running on bare-metal infrastructure deployed and managed by ClusterControl:

  • 192.168.0.21
  • 192.168.0.22
  • 192.168.0.23

Our applications are all running as pods within Kubernetes. The idea is to introduce two ProxySQL instances in between the application and our database cluster to serve as a reverse proxy. Applications will then connect to ProxySQL pods via Kubernetes service which will be load balanced and failover across a number of ProxySQL replicas.

The following is a summary of our Kubernetes setup:

root@kube1:~# kubectl get nodes -o wide
NAME    STATUS   ROLES    AGE     VERSION   INTERNAL-IP       EXTERNAL-IP   OS-IMAGE             KERNEL-VERSION      CONTAINER-RUNTIME
kube1   Ready    master   5m      v1.15.1   192.168.100.201   <none>        Ubuntu 18.04.1 LTS   4.15.0-39-generic   docker://18.9.7
kube2   Ready    <none>   4m1s    v1.15.1   192.168.100.202   <none>        Ubuntu 18.04.1 LTS   4.15.0-39-generic   docker://18.9.7
kube3   Ready    <none>   3m42s   v1.15.1   192.168.100.203   <none>        Ubuntu 18.04.1 LTS   4.15.0-39-generic   docker://18.9.7

ProxySQL Configuration via ConfigMap

Let's first prepare our base configuration which will be loaded into ConfigMap. Create a file called proxysql.cnf and add the following lines:

datadir="/var/lib/proxysql"

admin_variables=
{
    admin_credentials="proxysql-admin:adminpassw0rd;cluster1:secret1pass"
    mysql_ifaces="0.0.0.0:6032"
    refresh_interval=2000
    cluster_username="cluster1"
    cluster_password="secret1pass"
    cluster_check_interval_ms=200
    cluster_check_status_frequency=100
    cluster_mysql_query_rules_save_to_disk=true
    cluster_mysql_servers_save_to_disk=true
    cluster_mysql_users_save_to_disk=true
    cluster_proxysql_servers_save_to_disk=true
    cluster_mysql_query_rules_diffs_before_sync=3
    cluster_mysql_servers_diffs_before_sync=3
    cluster_mysql_users_diffs_before_sync=3
    cluster_proxysql_servers_diffs_before_sync=3
}

mysql_variables=
{
    threads=4
    max_connections=2048
    default_query_delay=0
    default_query_timeout=36000000
    have_compress=true
    poll_timeout=2000
    interfaces="0.0.0.0:6033;/tmp/proxysql.sock"
    default_schema="information_schema"
    stacksize=1048576
    server_version="5.1.30"
    connect_timeout_server=10000
    monitor_history=60000
    monitor_connect_interval=200000
    monitor_ping_interval=200000
    ping_interval_server_msec=10000
    ping_timeout_server=200
    commands_stats=true
    sessions_sort=true
    monitor_username="proxysql"
    monitor_password="proxysqlpassw0rd"
    monitor_galera_healthcheck_interval=2000
    monitor_galera_healthcheck_timeout=800
}

mysql_galera_hostgroups =
(
    {
        writer_hostgroup=10
        backup_writer_hostgroup=20
        reader_hostgroup=30
        offline_hostgroup=9999
        max_writers=1
        writer_is_also_reader=1
        max_transactions_behind=30
        active=1
    }
)

mysql_servers =
(
    { address="192.168.0.21" , port=3306 , hostgroup=10, max_connections=100 },
    { address="192.168.0.22" , port=3306 , hostgroup=10, max_connections=100 },
    { address="192.168.0.23" , port=3306 , hostgroup=10, max_connections=100 }
)

mysql_query_rules =
(
    {
        rule_id=100
        active=1
        match_pattern="^SELECT .* FOR UPDATE"
        destination_hostgroup=10
        apply=1
    },
    {
        rule_id=200
        active=1
        match_pattern="^SELECT .*"
        destination_hostgroup=20
        apply=1
    },
    {
        rule_id=300
        active=1
        match_pattern=".*"
        destination_hostgroup=10
        apply=1
    }
)

mysql_users =
(
    { username = "wordpress", password = "passw0rd", default_hostgroup = 10, transaction_persistent = 0, active = 1 },
    { username = "sbtest", password = "passw0rd", default_hostgroup = 10, transaction_persistent = 0, active = 1 }
)

proxysql_servers =
(
    { hostname = "proxysql-0.proxysqlcluster", port = 6032, weight = 1 },
    { hostname = "proxysql-1.proxysqlcluster", port = 6032, weight = 1 }
)

Some of the above configuration lines are explained per section below:

admin_variables

Pay attention on the admin_credentials variable where we used non-default user which is "proxysql-admin". ProxySQL reserves the default "admin" user for local connection via localhost only. Therefore, we have to use other users to access the ProxySQL instance remotely. Otherwise, you would get the following error:

ERROR 1040 (42000): User 'admin' can only connect locally

We also appended the cluster_username and cluster_password value in the admin_credentials line, separated by semicolon to allow automatic syncing to happen. All variables prefixed with cluster_* are related to ProxySQL native clustering and are self-explanatory.

mysql_galera_hostgroups

This is a new directive introduced for ProxySQL 2.x (our ProxySQL image is running on 2.0.5). If you would like to run on ProxySQL 1.x, do remove this part and use scheduler table instead. We already explained the configuration details in this blog post, How to Run and Configure ProxySQL 2.0 for MySQL Galera Cluster on Docker under "ProxySQL 2.x Support for Galera Cluster".

mysql_servers

All lines are self-explanatory, which is based on three database servers running in MySQL Galera Cluster as summarized in the following Topology screenshot taken from ClusterControl:

proxysql_servers

Here we define a list of ProxySQL peers:

  • hostname - Peer's hostname/IP address
  • port - Peer's admin port
  • weight - Currently unused, but in the roadmap for future enhancements
  • comment - Free form comment field

In Docker/Kubernetes environment, there are multiple ways to discover and link up container hostnames or IP addresses and insert them into this table, either by using ConfigMap, manual insert, via entrypoint.sh scripting, environment variables or some other means. In Kubernetes, depending on the ReplicationController or Deployment method used, guessing the pod's resolvable hostname in advanced is somewhat tricky unless if you are running on StatefulSet.

Check out this tutorial on StatefulState pod ordinal index which provides a stable resolvable hostname for the created pods. Combine this with headless service (explained further down), the resolvable hostname format would be:

{app_name}-{index_number}.{service}

Where {service} is a headless service, which explains where "proxysql-0.proxysqlcluster" and "proxysql-1.proxysqlcluster" come from. If you want to have more than 2 replicas, add more entries accordingly by appending an ascending index number relative to the StatefulSet application name.

Now we are ready to push the configuration file into ConfigMap, which will be mounted into every ProxySQL pod during deployment:

$ kubectl create configmap proxysql-configmap --from-file=proxysql.cnf

Verify if our ConfigMap is loaded correctly:

$ kubectl get configmap
NAME                 DATA   AGE
proxysql-configmap   1      7h57m

Creating ProxySQL Monitoring User

The next step before we start the deployment is to create ProxySQL monitoring user in our database cluster. Since we are running on Galera cluster, run the following statements on one of the Galera nodes:

mysql> CREATE USER 'proxysql'@'%' IDENTIFIED BY 'proxysqlpassw0rd';
mysql> GRANT USAGE ON *.* TO 'proxysql'@'%';

If you haven't created the MySQL users (as specified under mysql_users section above), we have to create them as well:

mysql> CREATE USER 'wordpress'@'%' IDENTIFIED BY 'passw0rd';
mysql> GRANT ALL PRIVILEGES ON wordpress.* TO 'wordpress'@'%';
mysql> CREATE USER 'sbtest'@'%' IDENTIFIED BY 'passw0rd';
mysql> GRANT ALL PRIVILEGES ON sbtest.* TO 'proxysql'@'%';

That's it. We are now ready to start the deployment.

Deploying a StatefulSet

We will start by creating two ProxySQL instances, or replicas for redundancy purposes using StatefulSet.

Let's start by creating a text file called proxysql-ss-svc.yml and add the following lines:

apiVersion: apps/v1
kind: StatefulSet
metadata:
  name: proxysql
  labels:
    app: proxysql
spec:
  replicas: 2
  serviceName: proxysqlcluster
  selector:
    matchLabels:
      app: proxysql
      tier: frontend
  updateStrategy:
    type: RollingUpdate
  template:
    metadata:
      labels:
        app: proxysql
        tier: frontend
    spec:
      restartPolicy: Always
      containers:
      - image: severalnines/proxysql:2.0.4
        name: proxysql
        volumeMounts:
        - name: proxysql-config
          mountPath: /etc/proxysql.cnf
          subPath: proxysql.cnf
        ports:
        - containerPort: 6033
          name: proxysql-mysql
        - containerPort: 6032
          name: proxysql-admin
      volumes:
      - name: proxysql-config
        configMap:
          name: proxysql-configmap
---
apiVersion: v1
kind: Service
metadata:
  annotations:
  labels:
    app: proxysql
    tier: frontend
  name: proxysql
spec:
  ports:
  - name: proxysql-mysql
    port: 6033
    protocol: TCP
    targetPort: 6033
  - name: proxysql-admin
    nodePort: 30032
    port: 6032
    protocol: TCP
    targetPort: 6032
  selector:
    app: proxysql
    tier: frontend
  type: NodePort

There are two sections of the above definition - StatefulSet and Service. The StatefulSet is the definition of our pods, or replicas and the mount point for our ConfigMap volume, loaded from proxysql-configmap. The next section is the service definition, where we define how the pods should be exposed and routed for internal or external network.

Verify the pod and service states:

$ kubectl get pods,svc
NAME             READY   STATUS    RESTARTS   AGE
pod/proxysql-0   1/1     Running   0          4m46s
pod/proxysql-1   1/1     Running   0          2m59s

NAME                      TYPE        CLUSTER-IP       EXTERNAL-IP   PORT(S)                         AGE
service/kubernetes        ClusterIP   10.96.0.1        <none>        443/TCP                         10h
service/proxysql          NodePort    10.111.240.193   <none>        6033:30314/TCP,6032:30032/TCP   5m28s

If you look at the pod's log, you would notice we got flooded with this warning:

$ kubectl logs -f proxysql-0
...
2019-08-01 19:06:18 ProxySQL_Cluster.cpp:215:ProxySQL_Cluster_Monitor_thread(): [WARNING] Cluster: unable to connect to peer proxysql-1.proxysqlcluster:6032 . Error: Unknown MySQL server host 'proxysql-1.proxysqlcluster' (0)

The above simply means proxysql-0 was unable to resolve "proxysql-1.proxysqlcluster" and connect to it, which is expected since we haven't created our headless service for DNS records that is going to be needed for inter-ProxySQL communication.

Kubernetes Headless Service

In order for ProxySQL pods to be able to resolve the anticipated FQDN and connect to it directly, the resolving process must be able to lookup the assigned target pod IP address and not the virtual IP address. This is where headless service comes into the picture. When creating a headless service by setting "clusterIP=None", no load-balancing is configured and no cluster IP (virtual IP) is allocated for this service. Only DNS is automatically configured. When you run a DNS query for headless service, you will get the list of the pods IP addresses.

Here is what it looks like if we look up the headless service DNS records for "proxysqlcluster" (in this example we had 3 ProxySQL instances):

$ host proxysqlcluster
proxysqlcluster.default.svc.cluster.local has address 10.40.0.2
proxysqlcluster.default.svc.cluster.local has address 10.40.0.3
proxysqlcluster.default.svc.cluster.local has address 10.32.0.2

While, the following output shows the DNS record for the standard service called "proxysql" which resolves to the clusterIP:

$ host proxysql
proxysql.default.svc.cluster.local has address 10.110.38.154

To create a headless service and attach it to the pods, one has to define the ServiceName inside the StatefulSet declaration, and the Service definition must have "clusterIP=None" as shown below. Create a text file called proxysql-headless-svc.yml and add the following lines:

apiVersion: v1
kind: Service
metadata:
  name: proxysqlcluster
  labels:
    app: proxysql
spec:
  clusterIP: None
  ports:
  - port: 6032
    name: proxysql-admin
  selector:
    app: proxysql

Create the headless service:

$ kubectl create -f proxysql-headless-svc.yml

Just for verification, at this point, we have the following services running:

$ kubectl get svc
NAME              TYPE        CLUSTER-IP      EXTERNAL-IP   PORT(S)                         AGE
kubernetes        ClusterIP   10.96.0.1       <none>        443/TCP                         8h
proxysql          NodePort    10.110.38.154   <none>        6033:30200/TCP,6032:30032/TCP   23m
proxysqlcluster   ClusterIP   None            <none>        6032/TCP                        4s

Now, check out one of our pod's log:

$ kubectl logs -f proxysql-0
...
2019-08-01 19:06:19 ProxySQL_Cluster.cpp:215:ProxySQL_Cluster_Monitor_thread(): [WARNING] Cluster: unable to connect to peer proxysql-1.proxysqlcluster:6032 . Error: Unknown MySQL server host 'proxysql-1.proxysqlcluster' (0)
2019-08-01 19:06:19 [INFO] Cluster: detected a new checksum for mysql_query_rules from peer proxysql-1.proxysqlcluster:6032, version 1, epoch 1564686376, checksum 0x3FEC69A5C9D96848 . Not syncing yet ...
2019-08-01 19:06:19 [INFO] Cluster: checksum for mysql_query_rules from peer proxysql-1.proxysqlcluster:6032 matches with local checksum 0x3FEC69A5C9D96848 , we won't sync.

You would notice the Cluster component is able to resolve, connect and detect a new checksum from the other peer, proxysql-1.proxysqlcluster on port 6032 via the headless service called "proxysqlcluster". Note that this service exposes port 6032 within Kubernetes network only, hence it is unreachable externally.

At this point, our deployment is now complete.

Connecting to ProxySQL

There are several ways to connect to ProxySQL services. The load-balanced MySQL connections should be sent to port 6033 from within Kubernetes network and use port 30033 if the client is connecting from an external network.

To connect to the ProxySQL admin interface from external network, we can connect to the port defined under NodePort section, 30032 (192.168.100.203 is the primary IP address of host kube3.local):

$ mysql -uproxysql-admin -padminpassw0rd -h192.168.100.203 -P30032

Use the clusterIP 10.110.38.154 (defined under "proxysql" service) on port 6032 if you want to access it from other pods in Kubernetes network.

Then perform the ProxySQL configuration changes as you wish and load them to runtime:

mysql> INSERT INTO mysql_users (username,password,default_hostgroup) VALUES ('newuser','passw0rd',10);
mysql> LOAD MYSQL USERS TO RUNTIME;

You will notice the following lines in one of the pods indicating the configuration syncing completes:

$ kubectl logs -f proxysql-0
...
2019-08-02 03:53:48 [INFO] Cluster: detected a peer proxysql-1.proxysqlcluster:6032 with mysql_users version 2, epoch 1564718027, diff_check 4. Own version: 1, epoch: 1564714803. Proceeding with remote sync
2019-08-02 03:53:48 [INFO] Cluster: detected peer proxysql-1.proxysqlcluster:6032 with mysql_users version 2, epoch 1564718027
2019-08-02 03:53:48 [INFO] Cluster: Fetching MySQL Users from peer proxysql-1.proxysqlcluster:6032 started
2019-08-02 03:53:48 [INFO] Cluster: Fetching MySQL Users from peer proxysql-1.proxysqlcluster:6032 completed

Keep in mind that the automatic syncing only happens if there is a configuration change in ProxySQL runtime. Therefore, it's vital to run "LOAD ... TO RUNTIME" statement before you can see the action. Don't forget to save the ProxySQL changes into the disk for persistency:

mysql> SAVE MYSQL USERS TO DISK;

Limitation

Note that there is a limitation to this setup due to ProxySQL does not support saving/exporting the active configuration into a text configuration file that we could use later on to load into ConfigMap for persistency. There is a feature request for this. Meanwhile, you could push the modifications to ConfigMap manually. Otherwise, if the pods were accidentally deleted, you would lose your current configuration because the new pods would be bootstrapped by whatever defined in the ConfigMap.

Special thanks to Sampath Kamineni, who sparked the idea of this blog post and provide insights about the use cases and implementation.

Validating Your PostgreSQL Backups on Docker

$
0
0

Backups are the vital and important part of any disaster recovery plan, taking backups of the production database is also a basic and an important part of PostgreSQL administration. However, DBA’s don’t often validate that those backups are reliable.

Every organization takes PostgreSQL database backups in different form, some may take a file system (physical) backup of the PostgreSQL data directories (using tools like Barman, PGBackRest) while others may take only logical backups (using pg_dump), and even others may take block level snapshots using tools like EBS or VMWare snapshot.

In this blog, we will show you how to validate your PostgreSQL backup by restoring the backup onto a Docker container using the tool pgBackRest for taking and restoring the backup. We are assuming that you already have knowledge on how to use PostgreSQL, Docker and pgBackRest.

Why Should You Use Docker?

Docker makes automation simpler, it also eases the job of integrating our PostgreSQL Backup Validation task in a CI/CD tools like CircleCI, Travis, GitLab or Jenkins. Using Docker avoids the time and resource we have to spend on bringing the new environment for testing the backup.

Demo Setup

Host 

Role

Installed

Packages 

Crontab

node-1 192.168.0.111

CentOS-7

Posgresql-11 primary Instance.

Created user and database “pgbench“ and initialized with pgbench tables.

postgresql-11, pgbackrest-2.15

Running pgbench every 5mins to simulate the workload.

node-2
192.168.0.112
CentOS-7

Test Machine - we will run our Docker validation on this host. 

docker-ce-18.06, pgbackrest-2.15


node-3

192.168.0.113

CentOS-7

pgBackRest Repository Host

pgbackrest-2.15

Running pgbackrest to take Incr backup every 4 hour

Diff backup every day

Full backup weekly 


For pgbackrest to work, I have setup passwordless SSH access between these nodes.

User “postgres” on node-1 and node-2 can login passwordless to user “pgbackrest” on node-3.

[vagrant@node-1 ~]$ sudo -u postgres ssh pgbackrest@node-3 uptime

 13:31:51 up  7:00, 1 user,  load average: 0.00, 0.01, 0.05

[vagrant@node-2 ~]$ sudo -u postgres ssh pgbackrest@node-3 uptime

 13:31:27 up  7:00, 1 user,  load average: 0.00, 0.01, 0.05

User “pgbackrest” on node-3 can login passwordless to user “postgres” on node-1 and node-2.

[vagrant@node-3 ~]$ sudo -u pgbackrest ssh postgres@node-1 uptime 

 13:32:29 up  7:02, 1 user,  load average: 1.18, 0.83, 0.58

[vagrant@node-3 ~]$ sudo -u pgbackrest ssh postgres@node-2 uptime 

 13:32:33 up  7:01, 1 user,  load average: 0.00, 0.01, 0.05

Overview of Backup Validation

Below is a brief overview of the steps we will be following for our PostgreSQL Backup Validation.

  1. Using the pgbackrest restore command we will fetch the latest backup from the pgBackRest Repository Host (node-3) to the Test Machine (node-2) directory /var/lib/pgsql/11/data
  2. During thedocker run, we mount the host machine (node-2) directory /var/lib/pgsql on the docker container and start the postgres/postmaster daemon from the mounted directory. We would also expose the port 5432 from container to host machine port 15432. 
  3. Once the docker container started running, we will connect to the PostgreSQL database via node-2:15432 and verify all tables and rows are restored. We would also check the PostgreSQL logs to make sure there is no ERROR message during the recovery and the instance has also reached the consistent state.

Most of the backup validation steps will be performed on host node-2.

Building the Docker Image

On node-2, create Dockerfile and build the docker image “postgresql:11”. In the below Dockerfile, we will apply the following changes over centos:7 base image.

  1. Installing postgresql-11, pgbackrest and openssh-clients. Openssh-clients is needed for pgbackrest.
  2. Configuring pgbackrest - We need pgbackrest configuration in the image to test PITR, without pgbackrest configuration restore_command would fail. As part of pgbackrest configuration 
    1. We are adding the pgbackrest repository host ip (192.168.0.113) in the config file /etc/pgbackrest.conf
    2. We also need password less SSH access between the docker container and pgbackrest repository host. For this, I am copying SSH_PRIVATE_KEY which I have already generated and I have also added it’s public key to the pgbackrest repository host ( pgbackrest@node-3 ) .
  3. VOLUME ["${PGHOME_DIR}"] - Defines the container directory /var/lib/pgsql as a mount point. While running docker run command we will specify node-2 host directory to this mount point.
  4. USER postgres - Any command, runs on the container will be executed as postgres user.
$ cat Dockerfile

FROM  centos:7


ARG PGBACKREST_REPO_HOST

ARG PGHOME_DIR=/var/lib/pgsql

## Adding Postgresql Repo for CentOS7

RUN yum -y install https://download.postgresql.org/pub/repos/yum/reporpms/EL-7-x86_64/pgdg-redhat-repo-latest.noarch.rpm

## Installing PostgreSQL

RUN yum -y install postgresql11 postgresql11-server postgresql11-devel postgresql11-contrib postgresql11-libs pgbackrest openssh-clients

## Adding configuration for pgbackrest, needed for WAL recovery and replication.

RUN echo -ne "[global]\nrepo1-host=${PGBACKREST_REPO_HOST}\n\n[pgbench]\npg1-path=/var/lib/pgsql/11/data\n"> /etc/pgbackrest.conf

## Adding Private Key to the Docker. Docker container would use this private key for pgbackrest wal recovery.

RUN mkdir -p ${PGHOME_DIR}/.ssh &&  chmod 0750 ${PGHOME_DIR}/.ssh

COPY --chown=postgres:postgres ./SSH_PRIVATE_KEY  ${PGHOME_DIR}/.ssh/id_rsa

RUN chmod 0600 ${PGHOME_DIR}/.ssh/id_rsa

RUN echo -ne "Host ${PGBACKREST_REPO_HOST}\n\tStrictHostKeyChecking no\n">> ${PGHOME_DIR}/.ssh/config

## Making "/var/lib/pgsql" as a mountable directory in the container

VOLUME ["${PGHOME_DIR}"]

## Setting postgres as the default user for any remaining commands

USER postgres

We now have two files, Dockerfile used by docker build and SSH_PRIVATE_KEY which we will be copied to the docker image. 

$ ls

Dockerfile  SSH_PRIVATE_KEY

Run the below command on node-2 to build our docker image. I have mentioned the pgbackrest repository host IP in the command and this IP will be used in pgbackrest parameter “repo-host”. 

$ docker build --no-cache -t postgresql:11 --build-arg PGBACKREST_REPO_HOST=192.168.0.113 .

Sending build context to Docker daemon  230.4kB

Step 1/12 : FROM  centos:7

 ---> 9f38484d220f

Step 2/12 : ARG PGBACKREST_REPO_HOST

 ---> Running in 8b7b36c6f151

Removing intermediate container 8b7b36c6f151

 ---> 31510e46e286

Step 3/12 : ARG PGHOME_DIR=/var/lib/pgsql

...

Step 4/12 : RUN yum -y install https://download.postgresql.org/pub/repos/yum/reporpms/EL-7-x86_64/pgdg-redhat-repo-latest.noarch.rpm

...

...

Step 12/12 : USER postgres

 ---> Running in c91abcf46440

Removing intermediate container c91abcf46440

 ---> bebce78df5ae

Successfully built bebce78df5ae

Successfully tagged postgresql:11

Make sure the image is successfully built, and check “postgresql:11” image is created recently as shown below.

$ docker image ls postgresql:11

REPOSITORY          TAG IMAGE ID            CREATED SIZE

postgresql          11 2e03ed2a5946        3 minutes ago 482MB

Restoring the PostgreSQL Backup

We will now restore our PostgreSQL backup maintained in pgbackrest backup repository host node-3. 

Below is the pgbackrest configuration file present on host node-2 and I have mentioned node-3 as pgbackrest repository host. Directory mentioned in the param pg1-path is where the PostgreSQL data directory would get restored.

[vagrant@node-2 ~]$ cat /etc/pgbackrest.conf 

[global]

log-level-file=detail

repo1-host=node-3


[pgbench]

pg1-path=/var/lib/pgsql/11/data

Using below pgbackrest restore command, postgresql data directory will be restored at node-2:/var/lib/pgsql/11/data

To validate PITR with the pgbackrest backup I have set --type=time --target='2019-07-30 06:24:50.241352+00', so that the WAL recovery stops before the mentioned time. 

[vagrant@node-2 ~]$ sudo -u postgres bash -c "/usr/bin/pgbackrest --type=time --target='2019-07-30 06:24:50.241352+00' --target-action=promote --recovery-option='standby_mode=on' --stanza=pgbench restore"

Above command may take time depending on the backup size and network bandwidth. Once restored, verify the size of the data directory and also check recovery.conf.

[vagrant@node-2 ~]$ sudo -u postgres du -sh /var/lib/pgsql/11/data 

2.1G    /var/lib/pgsql/11/data


[vagrant@node-2 ~]$ sudo -u postgres cat /var/lib/pgsql/11/data/recovery.conf

standby_mode = 'on'

restore_command = '/usr/bin/pgbackrest --stanza=pgbench archive-get %f "%p"'

recovery_target_time = '2019-07-30 06:24:50.241352+00'

Disable archive mode for PostgreSQL docker container.

[vagrant@node-2 ~]$ sudo -u postgres bash -c "echo 'archive_mode = off'>> /var/lib/pgsql/11/data/postgresql.auto.conf"

Start the docker container with the image “postgresql:11”. In the command we are 

  1. Setting container name as “pgbench”

  2. Mounting docker host(node-2) directory /var/lib/psql to the docker container directory /var/lib/psql 

  3. Exposing container port 5432 to port 15432 on node-2.

  4. Starting the postgres daemon using the command /usr/pgsql-11/bin/postmaster -D /var/lib/pgsql/11/data

[vagrant@node-2 ~]$ docker run --rm --name "pgbench" -v /var/lib/pgsql:/var/lib/pgsql -p 15432:5432 -d postgresql:11  /usr/pgsql-11/bin/postmaster -D /var/lib/pgsql/11/data

e54f2f65afa13b6a09236a476cb1de3d8e499310abcec2b121a6b35611dac276

Verify “pgbench” container is created and running.

[vagrant@node-2 ~]$ docker ps -f name=pgbench

CONTAINER ID        IMAGE COMMAND                  CREATED STATUS PORTS                     NAMES

e54f2f65afa1        postgresql:11 "/usr/pgsql-11/bin/p…"   34 seconds ago Up 33 seconds 0.0.0.0:15432->5432/tcp   pgbench

Validating PostgreSQL 

Since the host directory /var/lib/pgsql is shared with docker container, the logs generated by the PostgreSQL service is also visible from node-2. Verify today’s log to make sure PostgreSQL has started fine without any ERROR and make sure below log lines are present. 

[vagrant@node-2 ~]$ sudo -u postgres tailf /var/lib/pgsql/11/data/log/postgresql-Tue.csv

..

2019-07-30 06:38:34.633 UTC,,,7,,5d3fe5e9.7,5,,2019-07-30 06:38:33 UTC,1/0,0,LOG,00000,"consistent recovery state reached at E/CE000210",,,,,,,,,""

2019-07-30 06:38:34.633 UTC,,,1,,5d3fe5e9.1,2,,2019-07-30 06:38:33 UTC,,0,LOG,00000,"database system is ready to accept read only connections",,,,,,,,,""

2019-07-30 06:38:35.236 UTC,,,7,,5d3fe5e9.7,6,,2019-07-30 06:38:33 UTC,1/0,0,LOG,00000,"restored log file ""000000010000000E000000CF"" from archive",,,,,,,,,""

2019-07-30 06:38:36.210 UTC,,,7,,5d3fe5e9.7,7,,2019-07-30 06:38:33 UTC,1/0,0,LOG,00000,"restored log file ""000000010000000E000000D0"" from archive",,,,,,,,,""

...

2019-07-30 06:39:57.221 UTC,,,7,,5d3fe5e9.7,37,,2019-07-30 06:38:33 UTC,1/0,0,LOG,00000,"recovery stopping before commit of transaction 52181192, time 2019-07-30 06:25:01.576689+00",,,,,,,,,""

...

2019-07-30 06:40:00.682 UTC,,,7,,5d3fe5e9.7,47,,2019-07-30 06:38:33 UTC,1/0,0,LOG,00000,"archive recovery complete",,,,,,,,,""

Message "consistent recovery state reached at E/CE000210", indicates that with the pgbackrest backup data directory we were able to reach a consistent state.

Message "archive recovery complete", indicates that we are able to replay the WAL file backed-up by pgbackrest and able to recover without any issue.

Connect to postgresql instance via local port 15432 and verify tables and row counts.

[vagrant@node-2 ~]$ sudo -iu postgres /usr/pgsql-11/bin/psql  -p 15432 -h localhost -U pgbench 

Password for user pgbench: 

psql (11.4)

Type "help" for help.


pgbench=> \dt

              List of relations

 Schema |       Name | Type  | Owner  

--------+------------------+-------+---------

 public | pgbench_accounts | table | pgbench

 public | pgbench_branches | table | pgbench

 public | pgbench_history  | table | pgbench

 public | pgbench_tellers  | table | pgbench

(4 rows)


pgbench=> select * from pgbench_history limit 1;

 tid | bid |   aid | delta |           mtime | filler 

-----+-----+---------+-------+----------------------------+--------

  98 |   3 | 2584617 |   507 | 2019-07-30 06:20:01.412226 | 

(1 row)


pgbench=> select max(mtime) from pgbench_history ;

            max             

----------------------------

 2019-07-30 06:22:01.402245

(1 row)


pgbench=> select count(1) from pgbench_history ;

 count 

-------

 90677

(1 row)


pgbench=> select count(1) from pgbench_accounts ;

  count   

----------

 10000000

(1 row)

We have now restored our PostgreSQL backup on a docker container and also verified PITR. Once validating the backup we can stop the container and remove the data directory.

[vagrant@node-2 ~]$ docker stop pgbench

pgbench

[vagrant@node-2 ~]$ sudo -u postgres bash -c "rm -rf /var/lib/pgsql/11/data && mkdir -p /var/lib/pgsql/11/data && chmod 0700 /var/lib/pgsql/11/data"

Conclusion

In this blog, I demonstrated the backup validation using a small database on a small VirtualBox VM. Because of this, the backup validation was completed in just a few minutes. It’s important to note that in production you will need to choose a proper VM with enough Memory, CPU, and Disk to allow the backup validation to complete successfully. You can also automate the whole validation process in a bash script or even by integrating with a CI/CD pipeline so that you can regularly validate our PostgreSQL backups.

Viewing all 65 articles
Browse latest View live